Optional@lemmy.world to Political Memes@lemmy.world · 5 months agoOh how will they survivelemmy.worldimagemessage-square102fedilinkarrow-up1746arrow-down129
arrow-up1717arrow-down1imageOh how will they survivelemmy.worldOptional@lemmy.world to Political Memes@lemmy.world · 5 months agomessage-square102fedilink
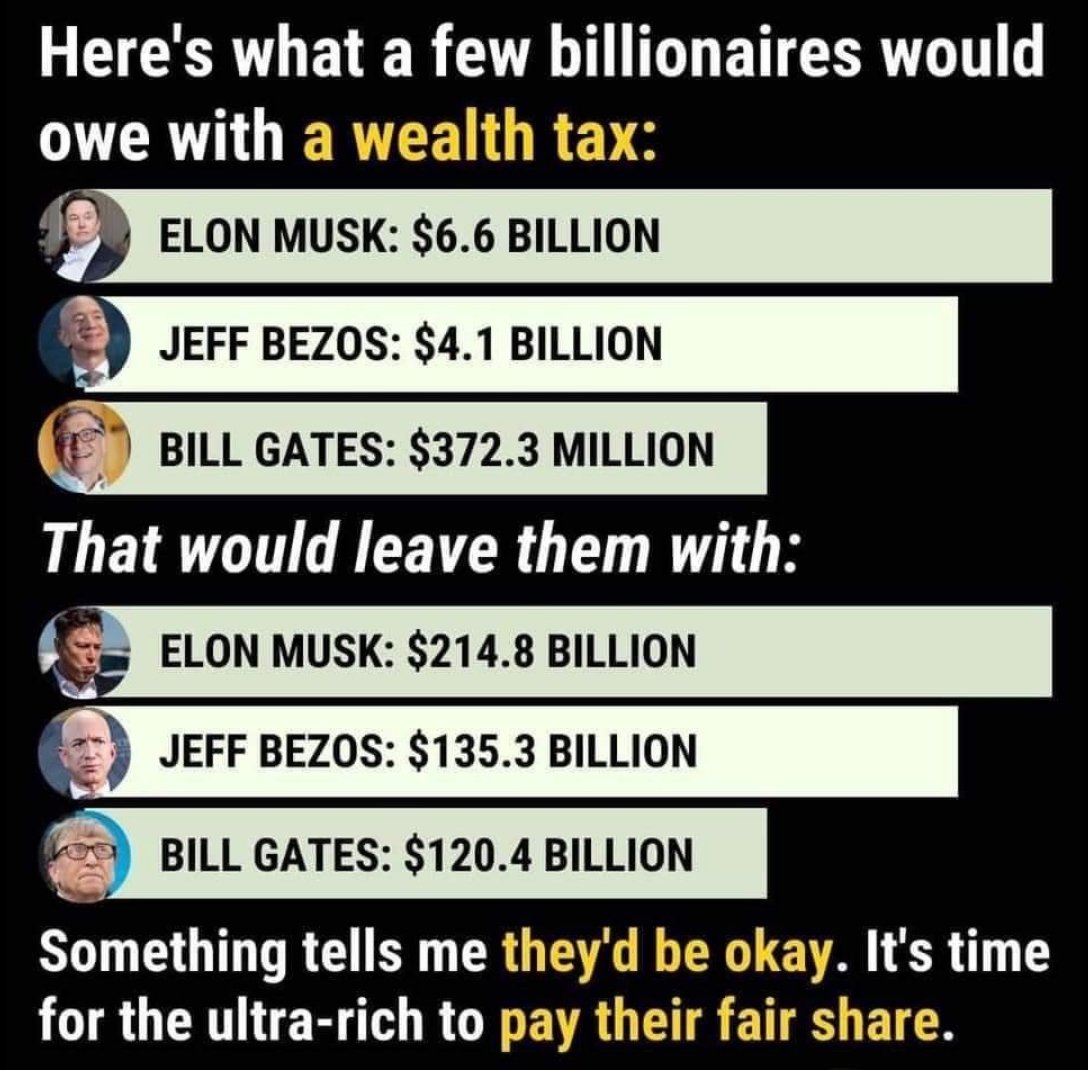
minus-squareChaoticNeutralCzech@feddit.delinkfedilinkarrow-up4·edit-25 months ago4% every year, perhaps? Anyway, this graph assumes something between 3.0 and 3.1%, and exactly 10 times less (decimal point error?) for Gates.
4% every year, perhaps?
Anyway, this graph assumes something between 3.0 and 3.1%, and exactly 10 times less (decimal point error?) for Gates.