
- cross-posted to:
- [email protected]
- cross-posted to:
- [email protected]
You must log in or register to comment.
You could live like a god with that salary in south America.
I dunno about a god.
I compared the most expensive city in Brazil (Rio De Janeiro) with a “affordable” city in US (internet told me it was Green Bay, WI).
And we’re looking at a 50% difference. Which isn’t much compared to the gap of say southeast Asian countries.
Dunno but 35K is kinda similar to what a non corrupt congressman earns in my country. A little bit more actually.
You’d be earning even less
"Our merchants and masters complain much of the bad effects of high wages in raising the price and lessening the sale of goods. They say nothing concerning the bad effects of high profits. They are silent with regard to the pernicious effects of their own gains. They complain only of those of other people.”
― Adam Smith, An Inquiry into the Nature and Causes of the Wealth of Nations
Sounds like commie talk to me, this guy should read Ad- Wait a minute
I’m currently making $24K as a grad student. Ain’t nobody asking me shit!
That’s what I made as a grad student ten years ago, damn.
And yet, that was still the most I’d ever made in my life at that point.
The social contract:
“You get nothing. Work or die. Sleep in the barracks/pod. Eat the bugs.”
Which sounds… I dunno, why? If that’s the deal, I’m offered I have a few questions: why do I care about your laws, your social mores, even you saying you own shit, right?
And whenever I ask them, I get the shit beaten out of me.
This can’t be right. How does anyone survive on that?
From what I have seen, having a lot of roomates, eating very boring food and praying to a god you don’t believe in that your car doesn’t break down.
I looked around and the average salary Q4 last year was over $59k.. I don’t know what the meme used for the “half” metric, but if they used the entire population of the US that would certainly drive the average down by including people of non-working age. The average I cited probably doesn’t account for unemployment, but that’s only 3.7% so that’s not going to push the cited average much lower.
If half the working-age, non-disabled adults in this country were literally only making the meme wage or less it would be incredibly dire.
The average won’t tell you the halfway point if the data isn’t evenly distributed. The average of 1, 1, 1, 1, 1, 1, 1, 1, 1, 500 is 50.9. The median is what you want for the halfway point of a set. This meme looks like it is a couple years out of date, most recent measured median from 2020 is 40,480. But the meme was accurate as of 2018.
That website seems to be doing the mean average. The median average is 41k currently, and back in 2020 median income was 35k, so the OP post might be a few years old.
The (mean) average might be 59k now, but half of people are making below 41k. Median is generally a better stat because excessive incomes on the ends don’t skew it massively. Adjusted for inflation this is essentially the exact same situation workers have been in for half a century. Wage growth is non existent, adjusted for inflation.
9 people make 20k a year, 1 person makes 1,000,000 a year. Average salary is 118K, but 90% of people make less than 30k.
Not real numbers, but just to show that average does not mean “half of”.
That is why the median income is more interesting.
Because it’s wrong
https://www.bls.gov/news.release/wkyeng.t02.htm
$1,145 a week is the median, do the math
Stupid poor people. Simply be born wealthy, its not that hard.
How the fuck is anyone alive?
Parents filling in a lot of gaps
Lots of roommates and/or a low cost of living location. Food and utilities are not much. Skip medical care, or just didn’t pay for it.
Dual income, no kids, live in a basement.
Because the number is from before the pandemic when Trump was president
Multi generational housing is back.
Also somehow that’s true and a housing shortage is true at the same time.
A lot of distractions are cheaper now. Movies. Books. Steam sales. Social media is free.
Surprise! People with no money dont spend money on stuff :O
It appears that the claim that half of Americans make under $35,000 is not accurate. According to the U.S. Census Bureau, the median personal income in the United States for 2022 was $40,480 (FRED - https://fred.stlouisfed.org/series/MEPAINUSA646N). Additionally, data from DQYDJ shows that at the 40th percentile, income was approximately $58,001, suggesting that less than half of the population earns under $35,000 (DQYDJ – Don’t Quit Your Day Job - https://dqydj.com/average-median-top-household-income-percentiles/).
Furthermore, the median household income was reported to be $74,580 in 2022, a figure that significantly exceeds the $35,000 threshold (Census.gov - https://www.census.gov/library/publications/2023/demo/p60-279.html). This indicates that the median individual and household incomes in the U.S. are both higher than $35,000, disproving the initial claim.
Median weekly earnings of full time workers is over $1100/week now, so the median full time worker is probably making well over $50k/year, if they can hold down a job for the full year and work full time hours.
Lots of people don’t work because they don’t want to work, and don’t need to work: retirees, students, married to rich spouses, etc. Including them in the denominator can be helpful for measuring some things, but would be misleading to assume that the median individual income across all individuals would mean what most commenters in this thread seem to think it means.
If you look at what they count as full-time jobs, And then you compare that to how many people are actually willing to offer full-time jobs rather than just a job that takes all of your time you might better understand this.
The numbers are manipulated by what they choose to exclude. And $50,000 in today’s dollars is less than an elevator operator made during the Great depression.
what they count as full-time jobs
Isn’t that just anyone who works more than 35 hours per week?
full-time jobs rather than just a job that takes all of your time
What do you mean by this?
Either way, they track several different alternative measures. One is the number of people who want to work full time but are stuck working part time for economic reasons, which has been lower the last few years than the previous decade.
Or if you’d want to look at those who hold multiple jobs, that’s been climbing but still historically low.
are you trying to make me feel worse?
You’re mixing measurements. Household != Individual.
For you and [email protected], isn’t the Census bureau a national survey with self reporting that only covers like 1% of the population? Both “Fred” and dqydj.com use the Census bureau to calculate their viewpoints from what I understand? If I’m reading the government site wrong or looking at the wrong surveys please correct me. I understand the “Census” to be more of a judge or indicator of patterns but not to be used as concrete data in which to come to solid conclusions from.
I had ran into the census pdf as well before seeing this link, the beginning has an interesting passage which none of the authors seem to mention in the articles,
Real median household income was $74,580 in 2022, 2.3 percent lower than the 2021 estimate of $76,330. It was 4.7 percent lower than the 2019 median, the year before the start of the COVID-19 pandemic and the corresponding recession (Figure 1 and Table A-1).6 The estimate of median household income in 2019 was the highest since 1967 source
Also an important caveat,
The income estimates in the main sections of this report are based on the concept of money income, which is pretax and does not account for the value of in-kind transfers. Estimates of post-tax income and inequality are included in Appendix B. Real median post-tax household income exhibited a substantial decline in 2022 from 2021. This was due in part to the expiration of policies introduced in response to the COVID-19 pandemic, such as Economic Impact Payments and the expanded Child Tax Credit.
I’ve been reading over a few of the articles from www.dqydj.com and it feels very sketchy. I can pinpoint a few questionable passages that seem to pass on an intent, but in general how they dissect the data always has a “but we left out this part” footnote. It’s especially hilarious with the article you linked,
What was the median household income? In 2023, $74,202 was the median household income in the United States. This is up from $70,181 in 2022 (unadjusted for inflation – see below).
They then proceed below to show a graph that completely contradicts their statement.
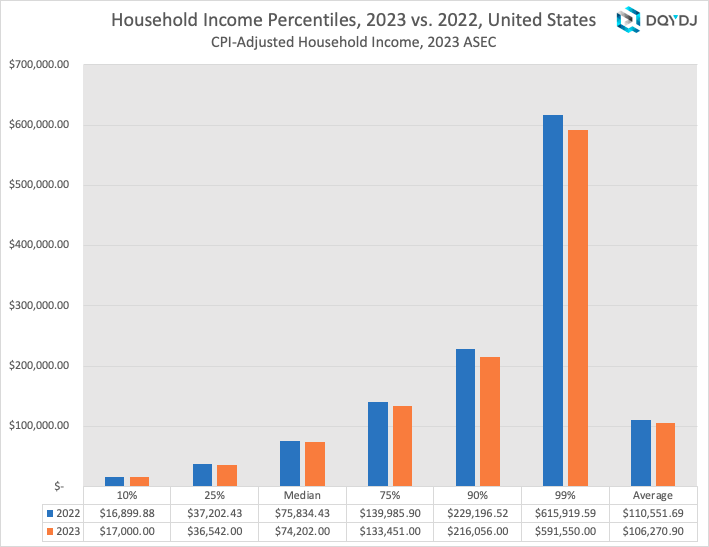
The paragraph above it makes a great copy-pasta though. If I’m reading any of this wrong, let me know.
If the median household income is 75k, assuming dual-income, then that’s probably where the 35k comes from: 75k/2 = 37.5k.
But there are significant amount of households who just have one person making 75K instead
so per worker, it’s actually 59K according to the data
Only 46% of the population are working. https://www.minneapolisfed.org/article/2022/whos-not-working-in-the-us-learn-the-basics So technically, technically the quote is correct. The stat you are quoting is the median salary of someone working full-time is $58,001. So it leaves out all those people un and underemployed or who just gave up on joining the workforce. Idk where you got the 40,480 because your link just goes to a broken link. Millennials are also making less money are less likely to be married and have higher unemployment numbers than gen x so our numbers would be more screwed than the overall median which is what the original tweet was referencing when saying stop asking us about buying houses or having kids.
Only 46% of the population are working.
Shouldn’t you be taking out children, students, retired people, and those who are unable to work?
The number is 76% if you only look at people aged 25-54.
Yeah but I’d also start start asking why you’re still voting Trump and believing he can be anyhow beneficial to your cause, or is that the other half making >35k a year who evidently then must have subconsciously self-organized like a swarm to unanimously vote for him?
I am no from the US, I don’t understand US, but probably you people vote for Trump because he promises something new
It’s not new anymore. Totally get the first time through, but not this time.
True, but something tells me his base are the “talk louder and slower to the foreigner” kind of people. Or in this case: “do it again, but harder.”
Shower thought: What if the journalists drawing attention to these problems are using twisted headlines to get the message past the same corporate masters? That the very voice of media is under the same yoke, struggling to get the word out?
Edit: So you change “Wage theft at all time high” to “Millennials claim fast food too expensive” to at least get people talking.
Afaik the headlines are normally not chosen by the journalists.
The figure referenced in this tweet is likely referring to the 2021 net compensation chart we saw making the rounds a few weeks back. Indeed, it’s correct, ~50% of all Americans made less than 35k per year in net total compensation in 2021.
In 2022, that figure rose to ~40k. So the trend is going in the right direction, at least. And IIRC, the chart does include teenagers, college students, people working part time or underemployed, etc.
The difference between top 10% and top 1% is shocking. And if they included 0.1% it would probably make all the other bars too small to see the difference at all.
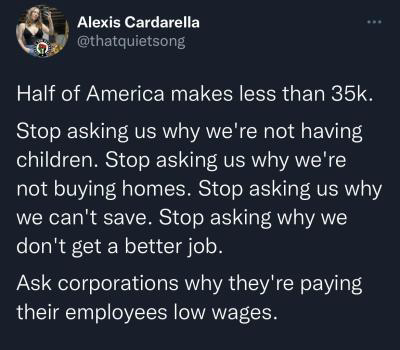
Also, that first “stop” sentence is a bit ‘ironic’, considering that statistically, in the US at least, the poorer you are, the more children you have.
Is this actually true? Independent, self-supporting people? Or is this skewed by all the people living with their parents still?
You mean skewed by a third of the 18-34 population?
I will only ask you why you don’t do something about it instead of just begging corporations.
That would be amazing if it were true, but it’s not. In 2022 the median income in USA was over $74k
Reminder that median means "half of the samples are above this point and half of the samples are below, which means exactly what was stated in the OP “half of America”
Source: https://www2.census.gov/programs-surveys/demo/tables/p60/279/tableA1.xlsx
The median net compensation for American workers in 2019 was $34,248.45, which is less than $35,000. So, the claim in the screenshot is apparently accurate for individuals. Granted, household income is a better indication of socioeconomic standing for people with spouses.
That’s from when Trump was president, it’s $CURRENT_YEAR, for God’s sake
Source?
OP is off by $5k according to this: https://fred.stlouisfed.org/series/MEPAINUSA646N Median personal income hit $40k in 2022.
/* Ignore my other comment if it’s not deleted for you yet *
This is specifically for combined household rate, which is different from individual earnings in that, well, it’s for two people and not a measure of how much the “average” American makes
My guess is they included children, who earn nothing, to get the average down that low
Maybe, but that would also be dishonest, because nobody is asking children why they are not having kids and not buying homes.
Oh I agree. They started with a premise and went about getting the numbers to match it, which is at best lousy journalism. I’m just theorizing about their methodology.
That’s “Household income”. Household income is the most useless and skewed statistic I can think of when it comes to equality and actual income per person.
In my mind rich people can afford to live in different homes. Poor people can not afford to do so. That means if 8 poor people who each make eg 10k a year share a household then their household earns 80k. Now if 8 less-poor people who each make eg 40k a year are split over four households then their households also make 80k each.
So now there’s 4 households of 2 people each that make as much as 1 household of 8 people. Here statistically 100% of households make exactly 40k. Regardless 50% of those 16 people still make less than 35k a year.
In reality people inside one household have different incomes, which means even among the 4 slightly richer households in the example above some inhabitants would probably make less than 35k.
It does! And one billionaire with a
wifelive-in sex worker (remember; they cannot love) erases thousands of dual-income partners living in povertyIt does!
Are you sure that it does? Some other people are claiming that it does not and I honestly have no idea who is correct. Do you have a source for this?
Okay so here’s what I remember from 4th grade (salt it heavily; that was decades ago and I had to flake on statistics class):
There are 3 kinds of ‘average’: The mean: values of all the things added together, divided by number of things
Median: take the… I think the mean, but maybe highest and lowest, then find the actual number in the data set closest to it
Mode: number that occurs most often in the data set.
Pretty sure this uses mean. That’s the common one. Look what happens to that data when you remove extreme outliers, or just the top 1%.
Household income doesn’t mean you and all your roommates. If you’re single and you have 3 roommates, your household is still just you for the purpose of calculating household income. If two families share a house, then each respective family has their own household income.
So what about young adults who can’t afford their own house and live with their parents or some other relatives? Are they excluded from these statistics? Do they count as a household consisting of only one person? Are they completely ignored in this statistics?
The PDF itself doesn’t specify these things. Nor does it confirm your claim. Maybe some of the data referred to in the many footnotes does. Wikipedia and Google results didn’t really answer those questions either, they only confirmed that there are many different ways to model a household.
If you’re single and you have 3 roommates, your household is still just you for the purpose of calculating household income.
Where did you hear this brother?
A household includes the related family members and all the unrelated people, if any, such as lodgers, foster children, wards, or employees who share the housing unit. A person living alone in a housing unit, or a group of unrelated people sharing a housing unit such as partners or roomers, is also counted as a household.
For the census, perhaps. Not for tax purposes.
That’s adding to the confusion and seems like a weird gotcha, we’re talking about the census as the person posted above as a source. The people who are confused and wrong seem to be stuck on tax filing status for some reason, I’m hoping obfuscation isn’t the goal.
Where did anyone get the idea that the statistic cited in the OP comes from the census?
…I’m going to lean on the side of this being trolling unless you’re just lost or not following the full conversation. We are in a comment chain discussing what [email protected] replied to OP with. No one is implying the OP image is census data, people are using the census data to dispute the OP image’s claims. I feel breaking it down further is redundant since you can just scroll back up and read all the replies.
Thanks for that, it really helps clearing things up!
Fantastic points! I totally missed that household part of it but I agree that judging based off household is a really distorted view of individual financial position.
Do you have data on individual incomes?
I don’t have any data. My goal was not to provide data but to call out the absurdness of creating statistics for abstract things like household incomes.
To think of household income, think of how you file taxes. You don’t claim roommates in your taxes, theyre not your household. If you and a significant other file jointly, that’s your household.
The stat isn’t as ridiculous as the other person claims
[email protected] posted the definitions used in the census survey above
A household includes the related family members and all the unrelated people, if any, such as lodgers, foster children, wards, or employees who share the housing unit. A person living alone in a housing unit, or a group of unrelated people sharing a housing unit such as partners or roomers, is also counted as a household.
People with multiple homes typically have one home that counts as their residency and those living in that house count as a household.
Other homes are secondary or recreational homes and are not counted to have residents.
Sometimes, rich people will claim to live in one home in a low income tax jurisdiction, while actually spending more time in a high income tax jurisdiction. This is tax fraud and the most recent famous case I can think of is Shakira.
Alright that makes sense. Is there any benefit to living together vs living alone as far as taxes are concerned? I suppose a couple owning two houses and each person claiming to live in a different house (ie two households) would still skew statistics.
It depends on jurisdiction.
In most countries, living together has a slight tax advantage. In some countries it has a disadvantage.
I couldn’t get link to work but I think you are looking at house hold. I looked up individual and it was 35.
Living with someone, roommate or partner, who you wouldn’t live with if you could afford the cheap solo life shouldn’t be a survival requirement.
I think you’re looking at stats for per capita income. I can’t find official data for individual income.
Thanks for providing this link. Looks like the actual number is likely a little higher than the ~40,000 shown by the graph, as these numbers include anyone 14+.


